Downtime: what a sensor measures and what operators add
Autor: Natalia Vyvial ·
Companies usually know they have downtime, but not which stoppages recur. Measuring on the machine does not close that gap by itself: it tells you that no work was done and says nothing about the cause. Useful data only emerges when what the sensor measures is combined with what the operator has to say about it.
Why do you find out about downtime too late?
Because that information travels via paper. The supervisor notes that the line was stopped, the note is copied somewhere at the end of the shift and appears in a spreadsheet a few days later. By the time the figures come together, there is nothing left to solve: the machine has long been running again and nobody remembers what they were waiting for.
That is why companies usually know they have downtime but not which stoppages recur. That is the difference the whole measurement rests on. A single stoppage is bad luck; a stoppage that comes back every Tuesday at changeover is a task with an address.
Do you have to interfere with the machine to measure it?
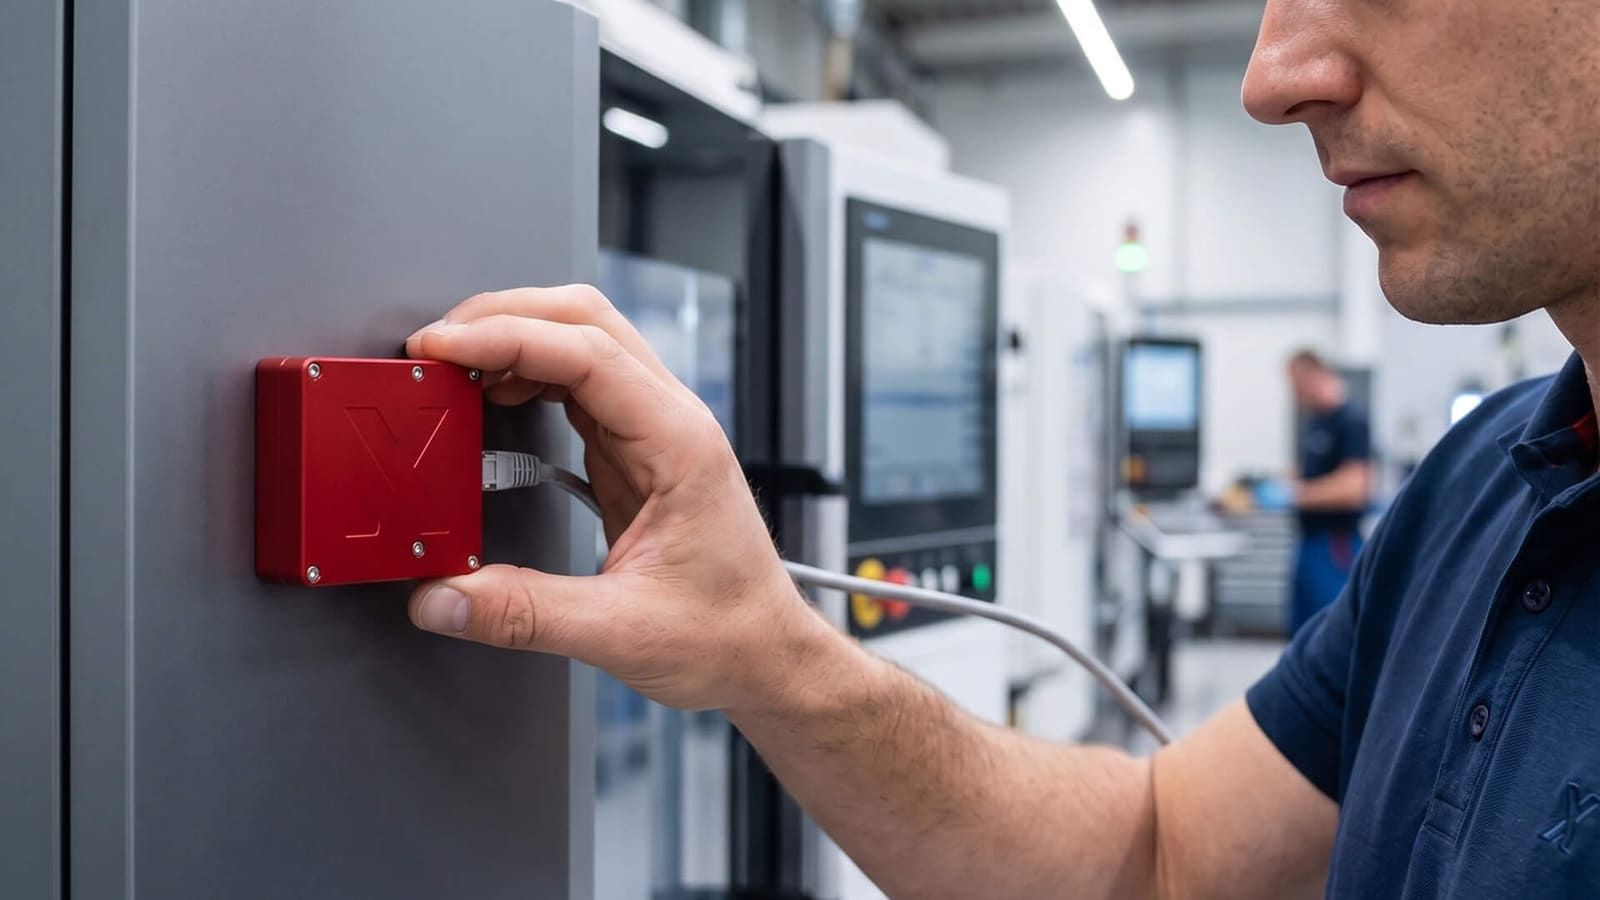
No, and this is the most common reason companies do not get started with measurement. They fear that someone will tamper with the machine's controls, that they will lose the warranty, or that an old press simply has nowhere to send data. Non-invasive sensors, however, are installed on a suitable part of the equipment or on its power supply, and the machine's control software is not changed.
Depending on what you need to monitor, the sensors measure the current in the phase conductors, the passage of an optical or magnetic marker, the physical movement of the equipment, or temperature and humidity. From this, the machine's activity, speed, conveyor movement or production cycles are derived. The standard sensor housing measures 14 × 32 × 41 mm, so it fits even where space is tight, and for unusual locations a custom housing is printed.
The second concern is usually the signal in a hall full of metal. The sensors can pass data on to one another towards the gateway, so the range of the wireless network can be extended without running cables. The gateway itself only needs to be connected to power and the internet; supported sensors nearby then register by themselves.
Why is machine data alone not enough?
Because it tells you that the machine was not working, but not why. And the reason is precisely what you can do something about. Was someone waiting for material, changing a tool, was an operator missing, was the previous operation at a standstill, or was planned maintenance being carried out? You cannot tell from the current-draw curve.
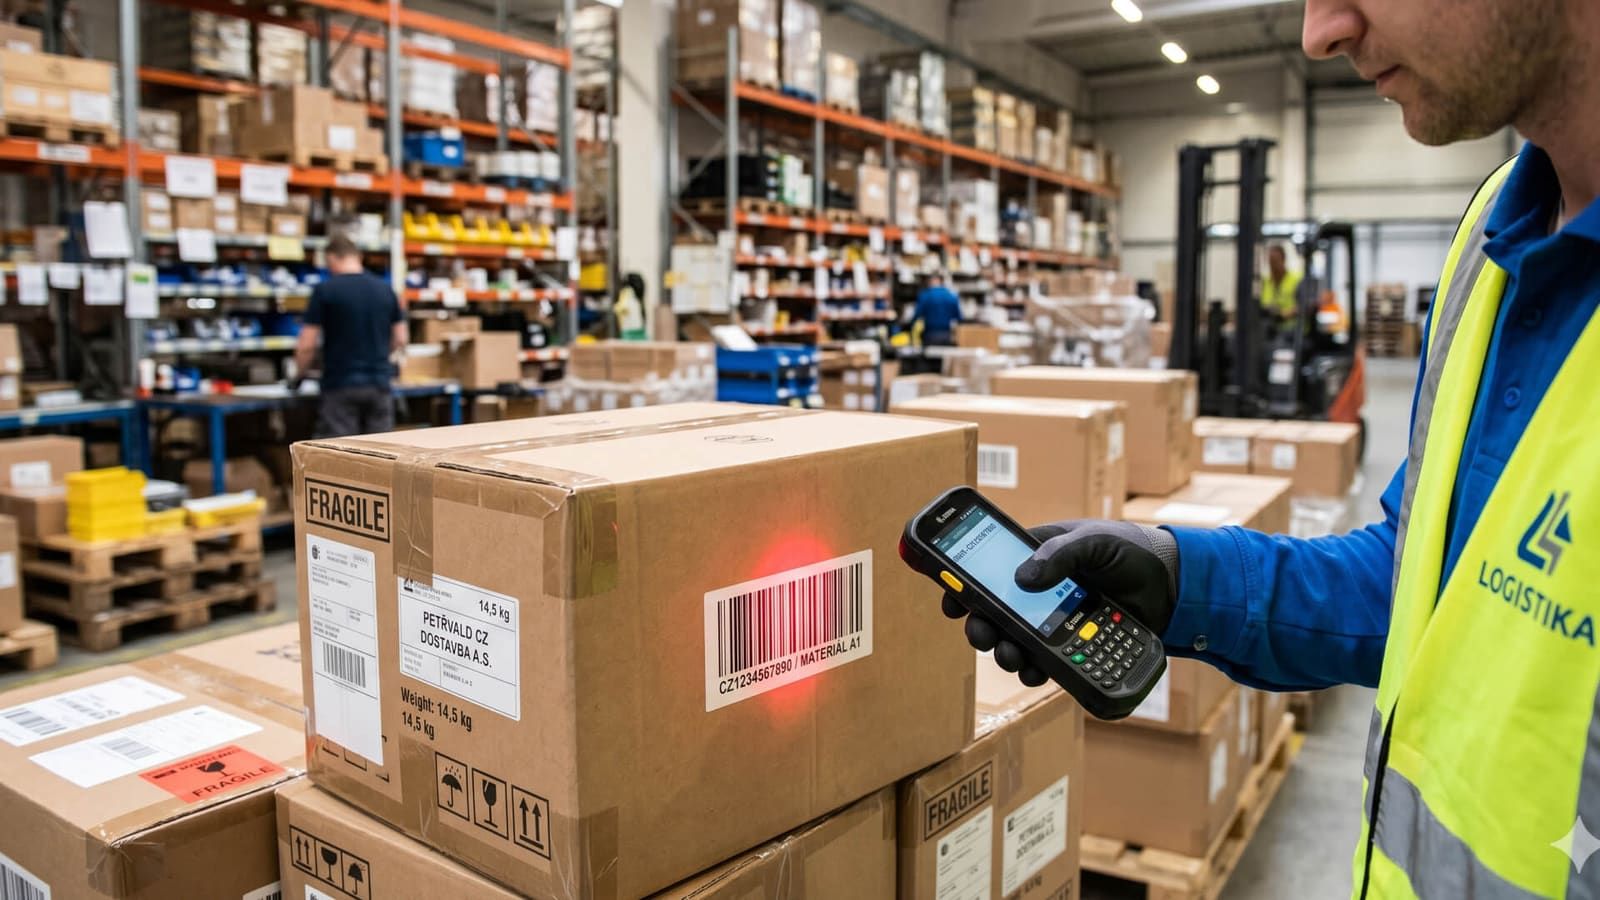
That is why the context is added by the operator in a mobile app: which order is being worked on, what activity is in progress and why a stoppage occurred. The order is loaded by scanning a barcode or QR code, so the measured data is matched to a specific piece of work, not to an hour in the calendar. Only combining the two gives you the following:
- Recurring stoppages sorted by cause, not just by duration.
- Unused capacity, meaning machines that others are waiting for as well as those that are unexpectedly idle.
- The real production effort of an order, and with it a basis for costing and pricing.
- The link between production conditions and rejects, because data on the machine and on the process is available for the non-conforming parts.
- A comparison of shifts and workstations based on figures collected the same way.
The third item tends to be the biggest surprise. Companies usually treat downtime as a production issue, but the result shows up in sales: once you know how much machine time an order really consumed, you stop subsidising some types of work out of the margin on others.
How long before you see anything?
The first data appears as soon as measurement starts, but a single day reveals nothing. For an evaluation, the standard is to work with roughly a week of production data, because only repetition shows what is the rule and what was a one-off fault. You can try it out with a seven-day test on one selected machine, without committing to the whole hall.
You can then access the data where you work with figures today: through ready-made reports in Power BI, your own dashboards, by downloading it to Excel, or via an API straight into your ERP, be it Navision, SAP or Helios. That is a more practical criterion than sensor resolution: data that nobody can get to, nobody will use.
When are sensors enough, and when do you need a manufacturing system?
Sensors measure, a system manages. As long as the question is “where are we losing time?”, measurement and reports based on it are enough. As soon as you want planning, costing and the reporting of finished parts to be driven by those figures, you are looking at a manufacturing system, that is, an MES.
anyCore covers this layer with 31 modules for production, sales and reporting, tracks availability, performance and quality via OEE, and compares workstations, machines and shifts. What matters is that you do not have to take all of it: you choose the modules that make sense now, start with a pilot on one workstation, and production does not stop for it. It connects to the ERP via connectors or via OpenAPI.
So the order is usually the reverse of how it is talked about at trade fairs: first a week of data from one machine, then a decision about what can be done with it. SensorX and anyCore are both supplied by NEXTERA tech from the E LINKX group; you will find both in the Production optimisation category, alongside data analytics.
Related products
- Production optimisation
anyCore
anyCore MES shows what is really happening in production. It links planning, orders, warehouses, machine data and reporting, and connects to your ERP.
NEXTERA tech- Production optimisation
SensorX
Find out where your production is losing output without touching machine control. SensorX combines machine data with what operators add and shows downtime and spare capacity.
NEXTERA tech- Production optimisation
Data analytics
Bring production data from machines, ERP and spreadsheets together in one overview. Dashboards and reports update continuously and show performance, deviations and connections.